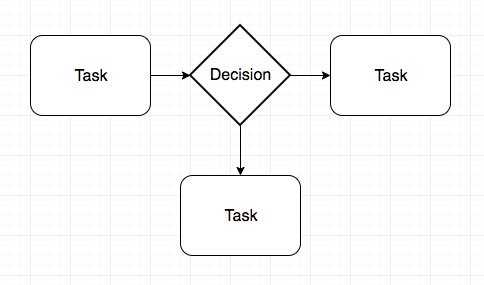
A Process Chart represents a sequence of inputs, steps, actions and decisions that form a process from start to finish. Each step in the process is represented by a specific symbol, linked by lines and arrows to show the direction. The Process Diagram or Chart (also known as a Workflow Diagram) visually represents an entire process or workflow from beginning to end.
Decoding the Language of Process Flow Chart Symbols
in Process Chart Symbols
Harnessing the Power of Online Process Flow Charts for Complex Project Management
in Online Flow Charts
Harnessing Spreadsheet Flow Charts for Complex Project Management
in Spreadsheet Flow Charts
Process Charts
in Process Charts
Mastering the Art of Process Charts: A Guide for Experts
in Process Charts
Mastering Spreadsheet Flow Charts
in Spreadsheet Flow Charts
Process Flow Chart Software
in Flow Chart Software
Online Process Flow Charts
in Online Flow Charts
Excel vs. Google Sheets: A Battle of Spreadsheet Flow Chart Capabilities
in Spreadsheet Flow Charts
The Advantages of Cloud-based Process Flow Chart Software for Remote Teams
in Flow Chart Software
Process Chart Symbols
in Process Chart Symbols
Using Process Flow Chart Software to Streamline Operations in the Supply Chain
in Flow Chart Software
Revolutionizing Data Visualization: Techniques in Spreadsheet Flow Chart Creation
in Spreadsheet Flow Charts
Process Charts in Manufacturing: Streamlining Production and Quality Control
in Process Charts
Optimizing Process Flow Charts: Advanced Techniques and Best Practices
in Process Charts
Mastering the Art of Process Flow Chart Symbols: Best Practices for Clarity and Efficiency
in Process Chart Symbols
 Process Charts, Process Diagrams, Workflow Diagrams etc are powerful business tools for analysing processes, and communicating processes and workflows simply and clearly.
- Project Planning
- Process Chart Applications
- Program Design
- System Design
- Process Auditing
- Documenting Processes
- Workflow Documentation
Process Chart Types
- Data flow diagrams
- Influence diagrams
- Workflow diagrams
- Swimlane flowcharts
- Process flow diagrams
- Yes/no flowcharts
- Decision flows
Business Process Model and Notation (BPMN)
Process Flow Charts usually use the set of symbols from the Business Process Model and Notation (BPMN) standard that have specific meanings and contexts. It is often called a BPMN Diagram.
There are four main element categories in BPMN:
- Connecting objects
- Flow objects
- Swimlanes
- Artifacts
The Power of Visualization
In the world of process improvement and optimization, having a clear understanding of your workflows and decision-making pathways is crucial. Process flow charts serve as an invaluable tool for visualizing complex processes, enabling you to gain valuable insights and streamline your operations. In this article, we'll provide an introduction to process flow charts, exploring their purpose, benefits, and applications, along with tips for creating effective flow charts for your organization.
What Are Process Flow Charts?
Process flow charts are visual representations of the steps, events, and decisions that make up a process or workflow. By breaking down complex processes into individual components and illustrating the relationships between them, flow charts enable you to quickly grasp the inner workings of a process and identify areas for improvement. Flow charts can be used to analyze and optimize processes across various industries and applications, from manufacturing and engineering to business management and software development.
Benefits of Process Flow Charts
Process flow charts offer numerous benefits for organizations seeking to optimize their processes and workflows. Some of the key advantages include:
-
Enhanced Understanding: Flow charts provide a clear and concise means of understanding complex processes, making it easier for team members and stakeholders to grasp the overall process structure and its individual components.
-
Improved Communication: By creating a shared visual language, flow charts facilitate better communication and collaboration among team members, ensuring that everyone is on the same page and working towards a common goal.
-
Streamlined Process Improvement: Flow charts enable you to identify bottlenecks, inefficiencies, and redundancies within your processes, providing the information needed to make targeted improvements and optimize your operations.
-
Reduced Errors and Downtime: By providing a clear visualization of process steps and decision points, flow charts can help to minimize errors and reduce downtime, ultimately enhancing overall process efficiency.
-
Effective Training and Onboarding: Flow charts serve as an excellent resource for training new team members and familiarizing them with your organization's processes, ensuring a smoother onboarding experience and promoting a greater understanding of their roles and responsibilities.
In conclusion, process flow charts are a powerful tool for visualizing and optimizing complex processes across various industries and applications. By understanding the purpose and benefits of flow charts, and employing the tips and best practices outlined in this article, you can create effective flow charts that enhance your organization's process efficiency and drive continuous improvement. So, dive into the world of process flow charts and unlock the potential they hold for your organization's success.